Incidence of infected ticks in individual regions
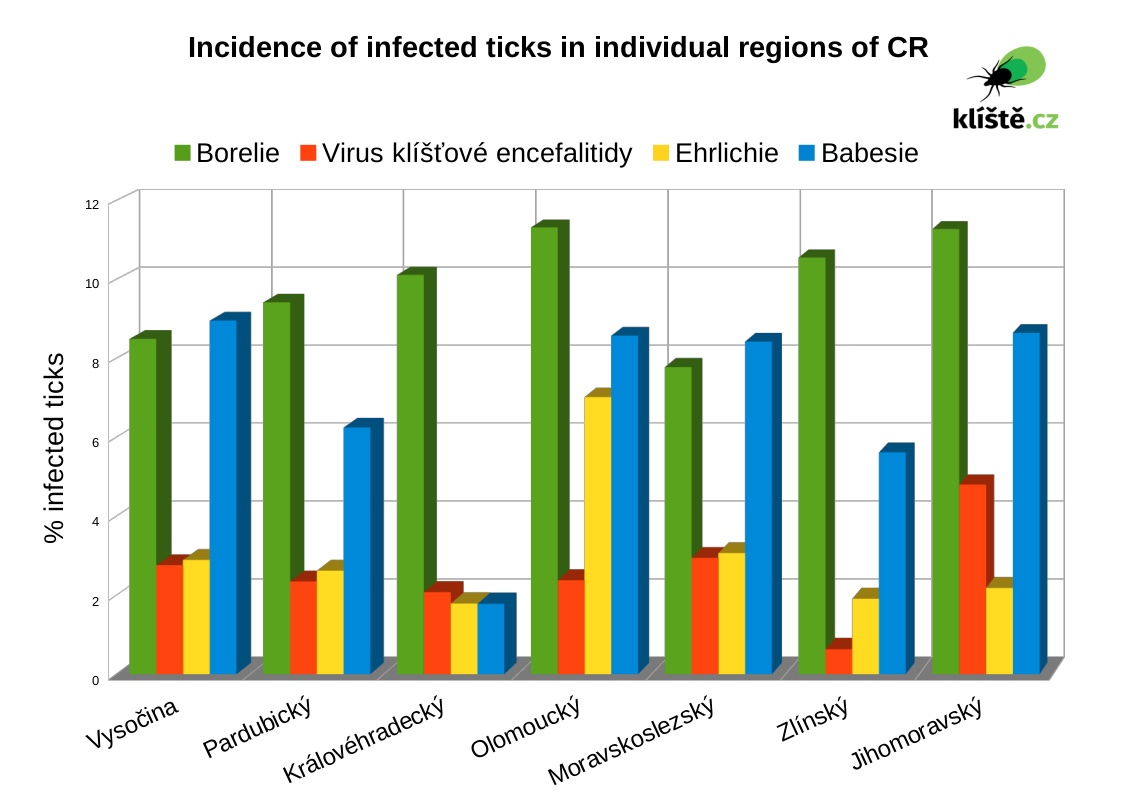
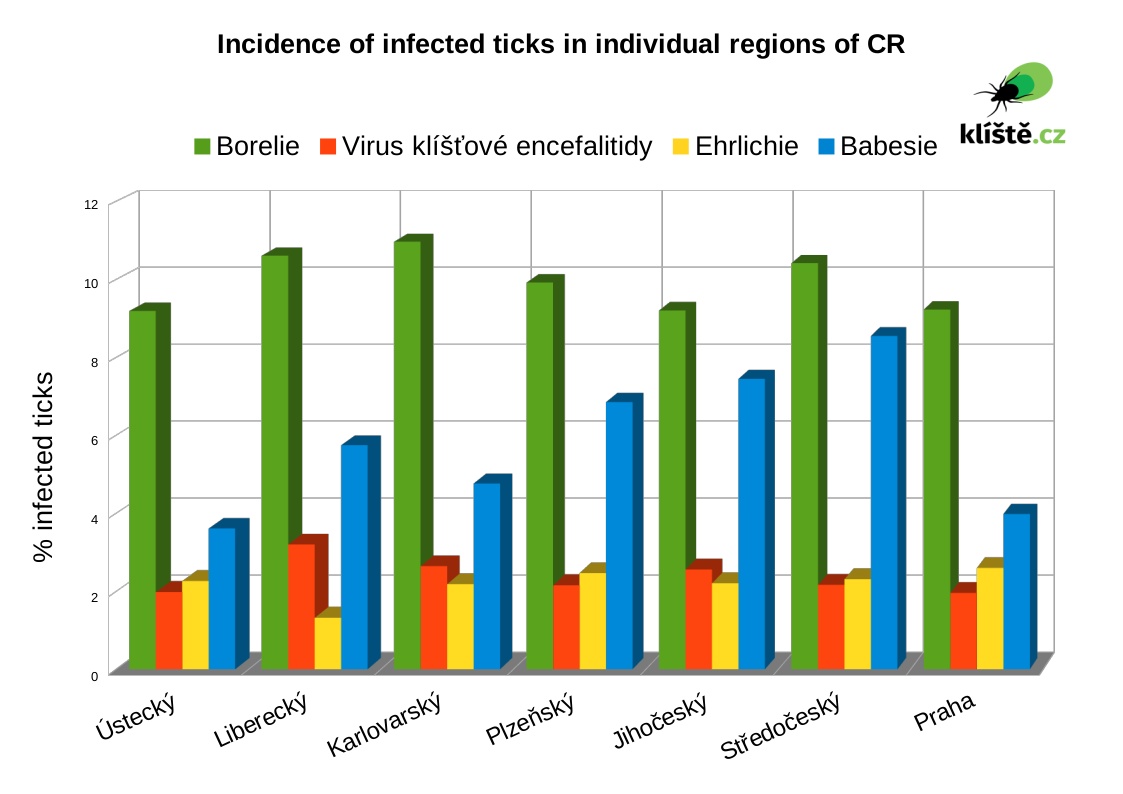
The graph depicts results from over ten thousand analyzed ticks acquired by the Protean s.r.o. laboratory. The graph represents the proportion of tick infected by borreliosis, tick-borne encephalitis (TBEV), ehrlichiosis and babesiosis in individual regions.


The data represent an overview of parasite analyses. The parasites (ticks) were analyzed after removal form human skin and originate from all over the Czech Republic. The geographical distribution of samples is thus very random and the results cannot be directly compared to results published in peer-reviewed literature, which analyze samples from specific locations. The results also cannot be compared to data describing the occurence of reported diseases where the number of people is influenced by the location popularity - for example touristic spots around rivers and water reservoirs.
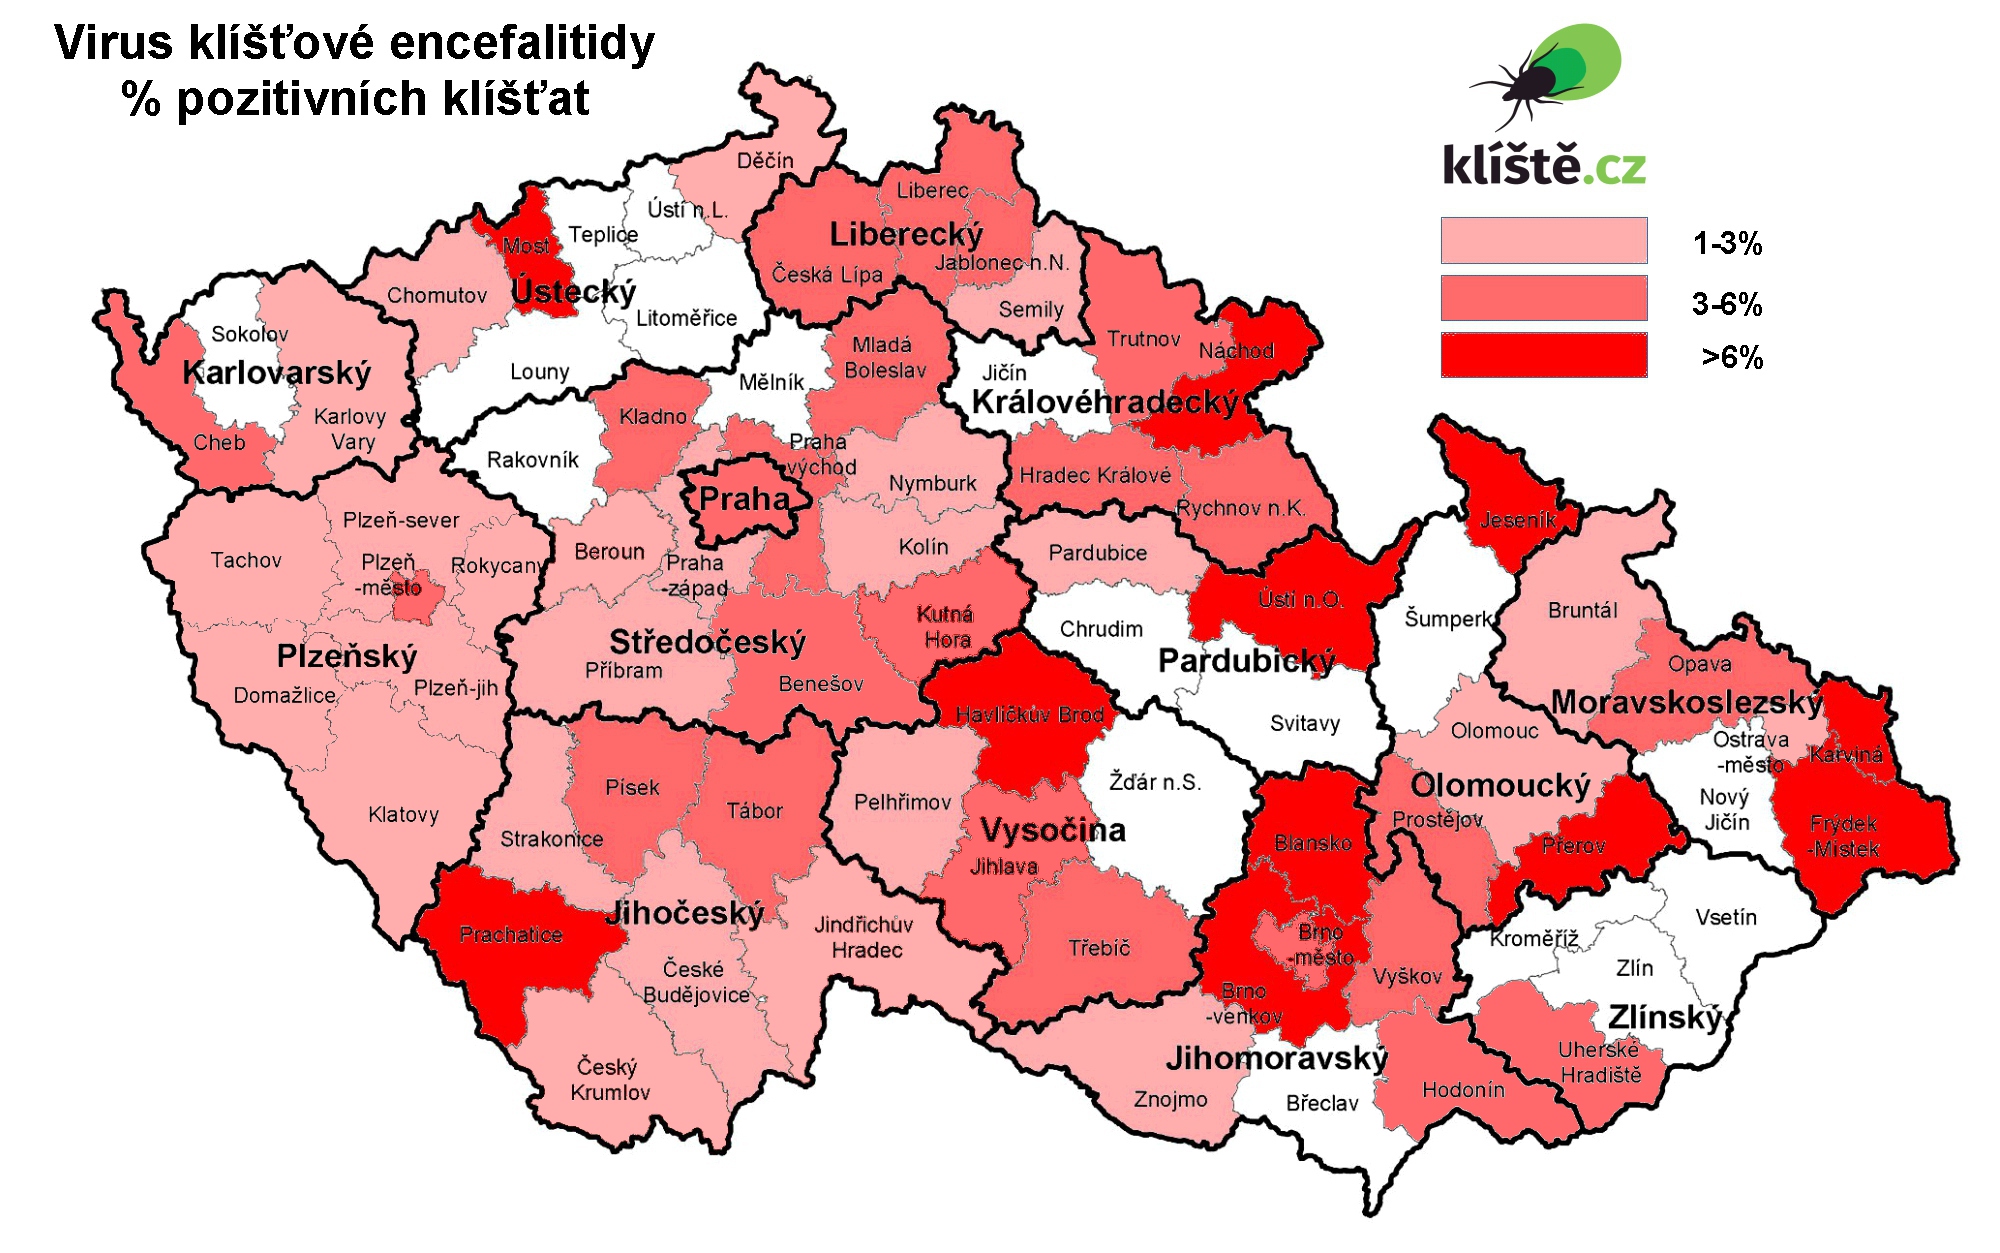
Due to low amounts of samples from certain locations, the data are not a statistical analysis. The absence of positive samples from a location does not indicate the absence of the parasite in that location.
An overview of infected tick incidence in individual districts is shown in maps.
